Instalação de Câmeras e Alarmes Intelbras
Instalação de Câmeras e Alarmes Intelbras. Proteção para sua empresa autorizada somos especializados em instalação de câmeras de segurança, alarmes e manutenção elétrica.
Câmeras de segurança de alta qualidade.
Alarmes eficientes para sua proteção.
Manutenção elétrica especializada e confiável.


Sobre Nós - Decide TI
Instalação de Câmeras e Alarmes Intelbras. Somos uma empresa autorizada Intelbras, especializada em instalação de câmeras de segurança, alarmes e manutenção elétrica. Oferecemos serviços com qualidade e um design moderno e responsivo.


Nossa Missão
Nossos Valores
Destaque em câmeras, alarmes e manutenção elétrica, garantimos a melhor infraestrutura tudo realizado com segurança, qualidade e comprometimento.
Nossos Serviços
Instalação de Câmeras e Alarmes Intelbras com qualidade e segurança.
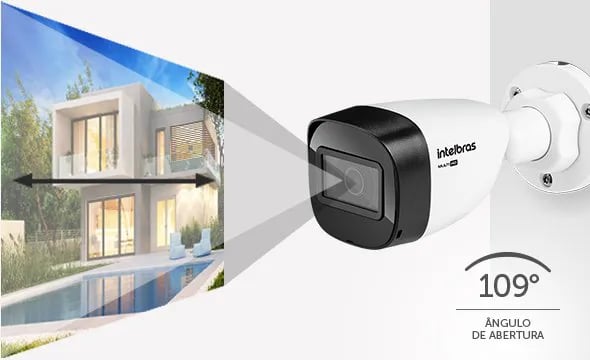
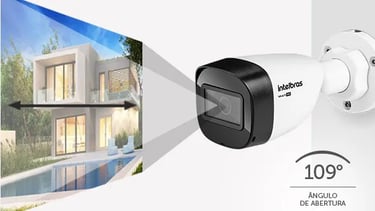
Câmeras de Segurança
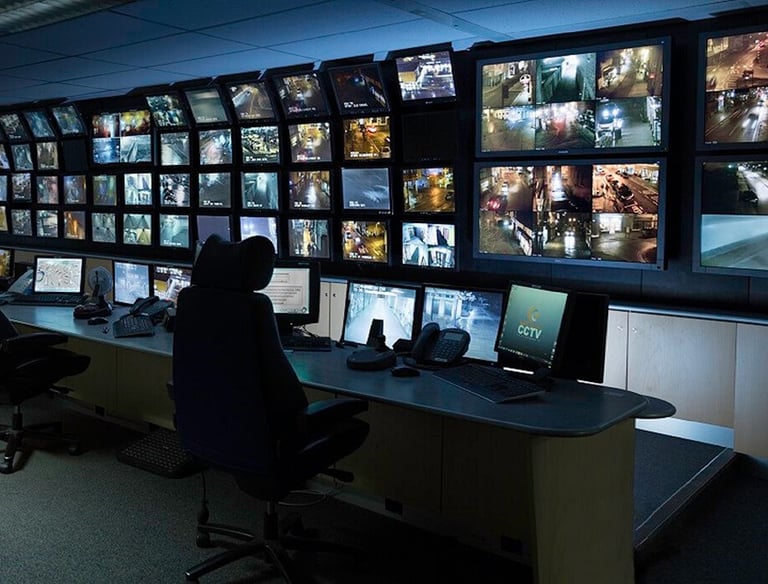
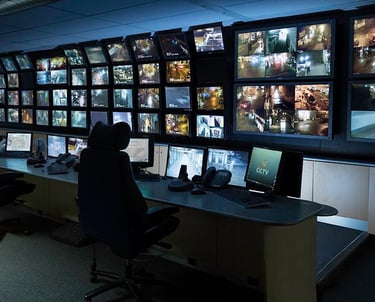
Instalação profissional de câmeras Intelbras para proteção e monitoramento eficaz.
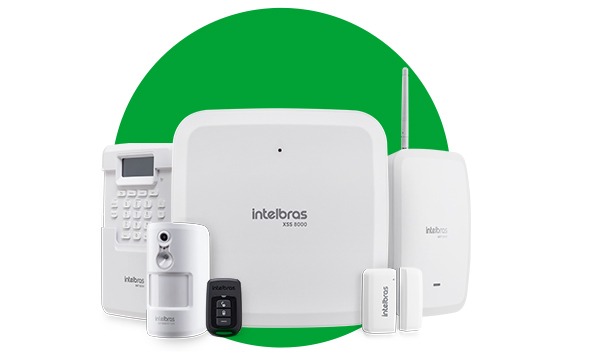
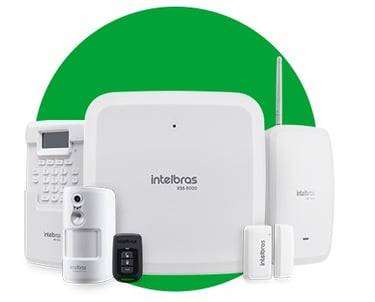
Alarmes Eficientes
Soluções em alarmes para garantir a segurança da sua empresa e patrimônio.
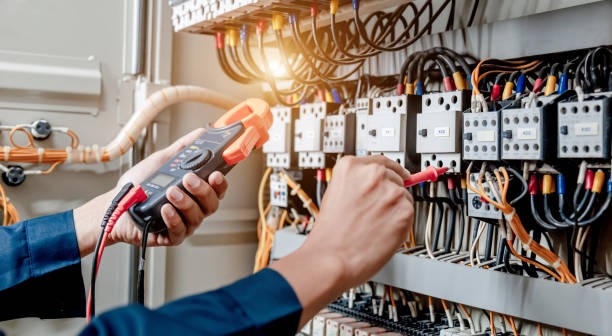
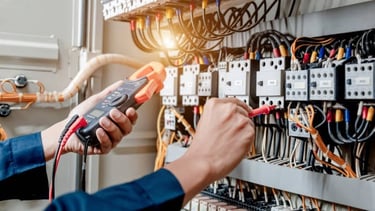
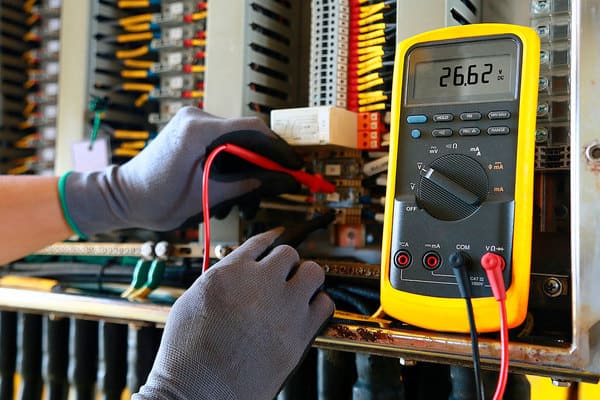
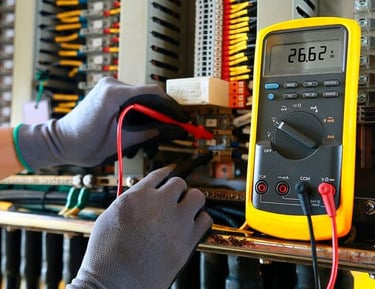
Serviços de manutenção elétrica para garantir a segurança e funcionalidade.
Manutenção Elétrica


Galeria de Serviços
Explore nossas soluções em câmeras, alarmes e manutenção elétrica.


